Chapter 4 Recommended Packages
4.1 Data Wrangling
Data wrangling is the process of transforming and mapping data from one “raw” data form into another format with the intent of making it more appropriate and valuable for a variety of downstream purposes such as analytics.
4.1.1 Tidy Data
The Tidyverse of packages are built around the concept of tidy data, first introduced by Jeff Leek in his book The Elements of Data Analytic Style. Hadley Wickham summarises the characteristics of tidy data with the following points:
- Each variable forms a column.
- Each observation forms a row.
- Each type of observational unit forms a table.
4.1.2 Importing Data
The first step in wrangling is importing the data into R. The methods to do so depend on the source of data:
- Reading files
- Connecting to databases
- Web APIs or pages
4.1.2.1 Reading Files
Files may come in many formats and R has packages to read many of them. The most common for data science are tabular text files, such as CSVs, and Excel spreadsheets. The recommended packages for reading these files are:.
For more detail, read the Data Import chapter in the R for Data Science book or use the cheatsheet below for reference.
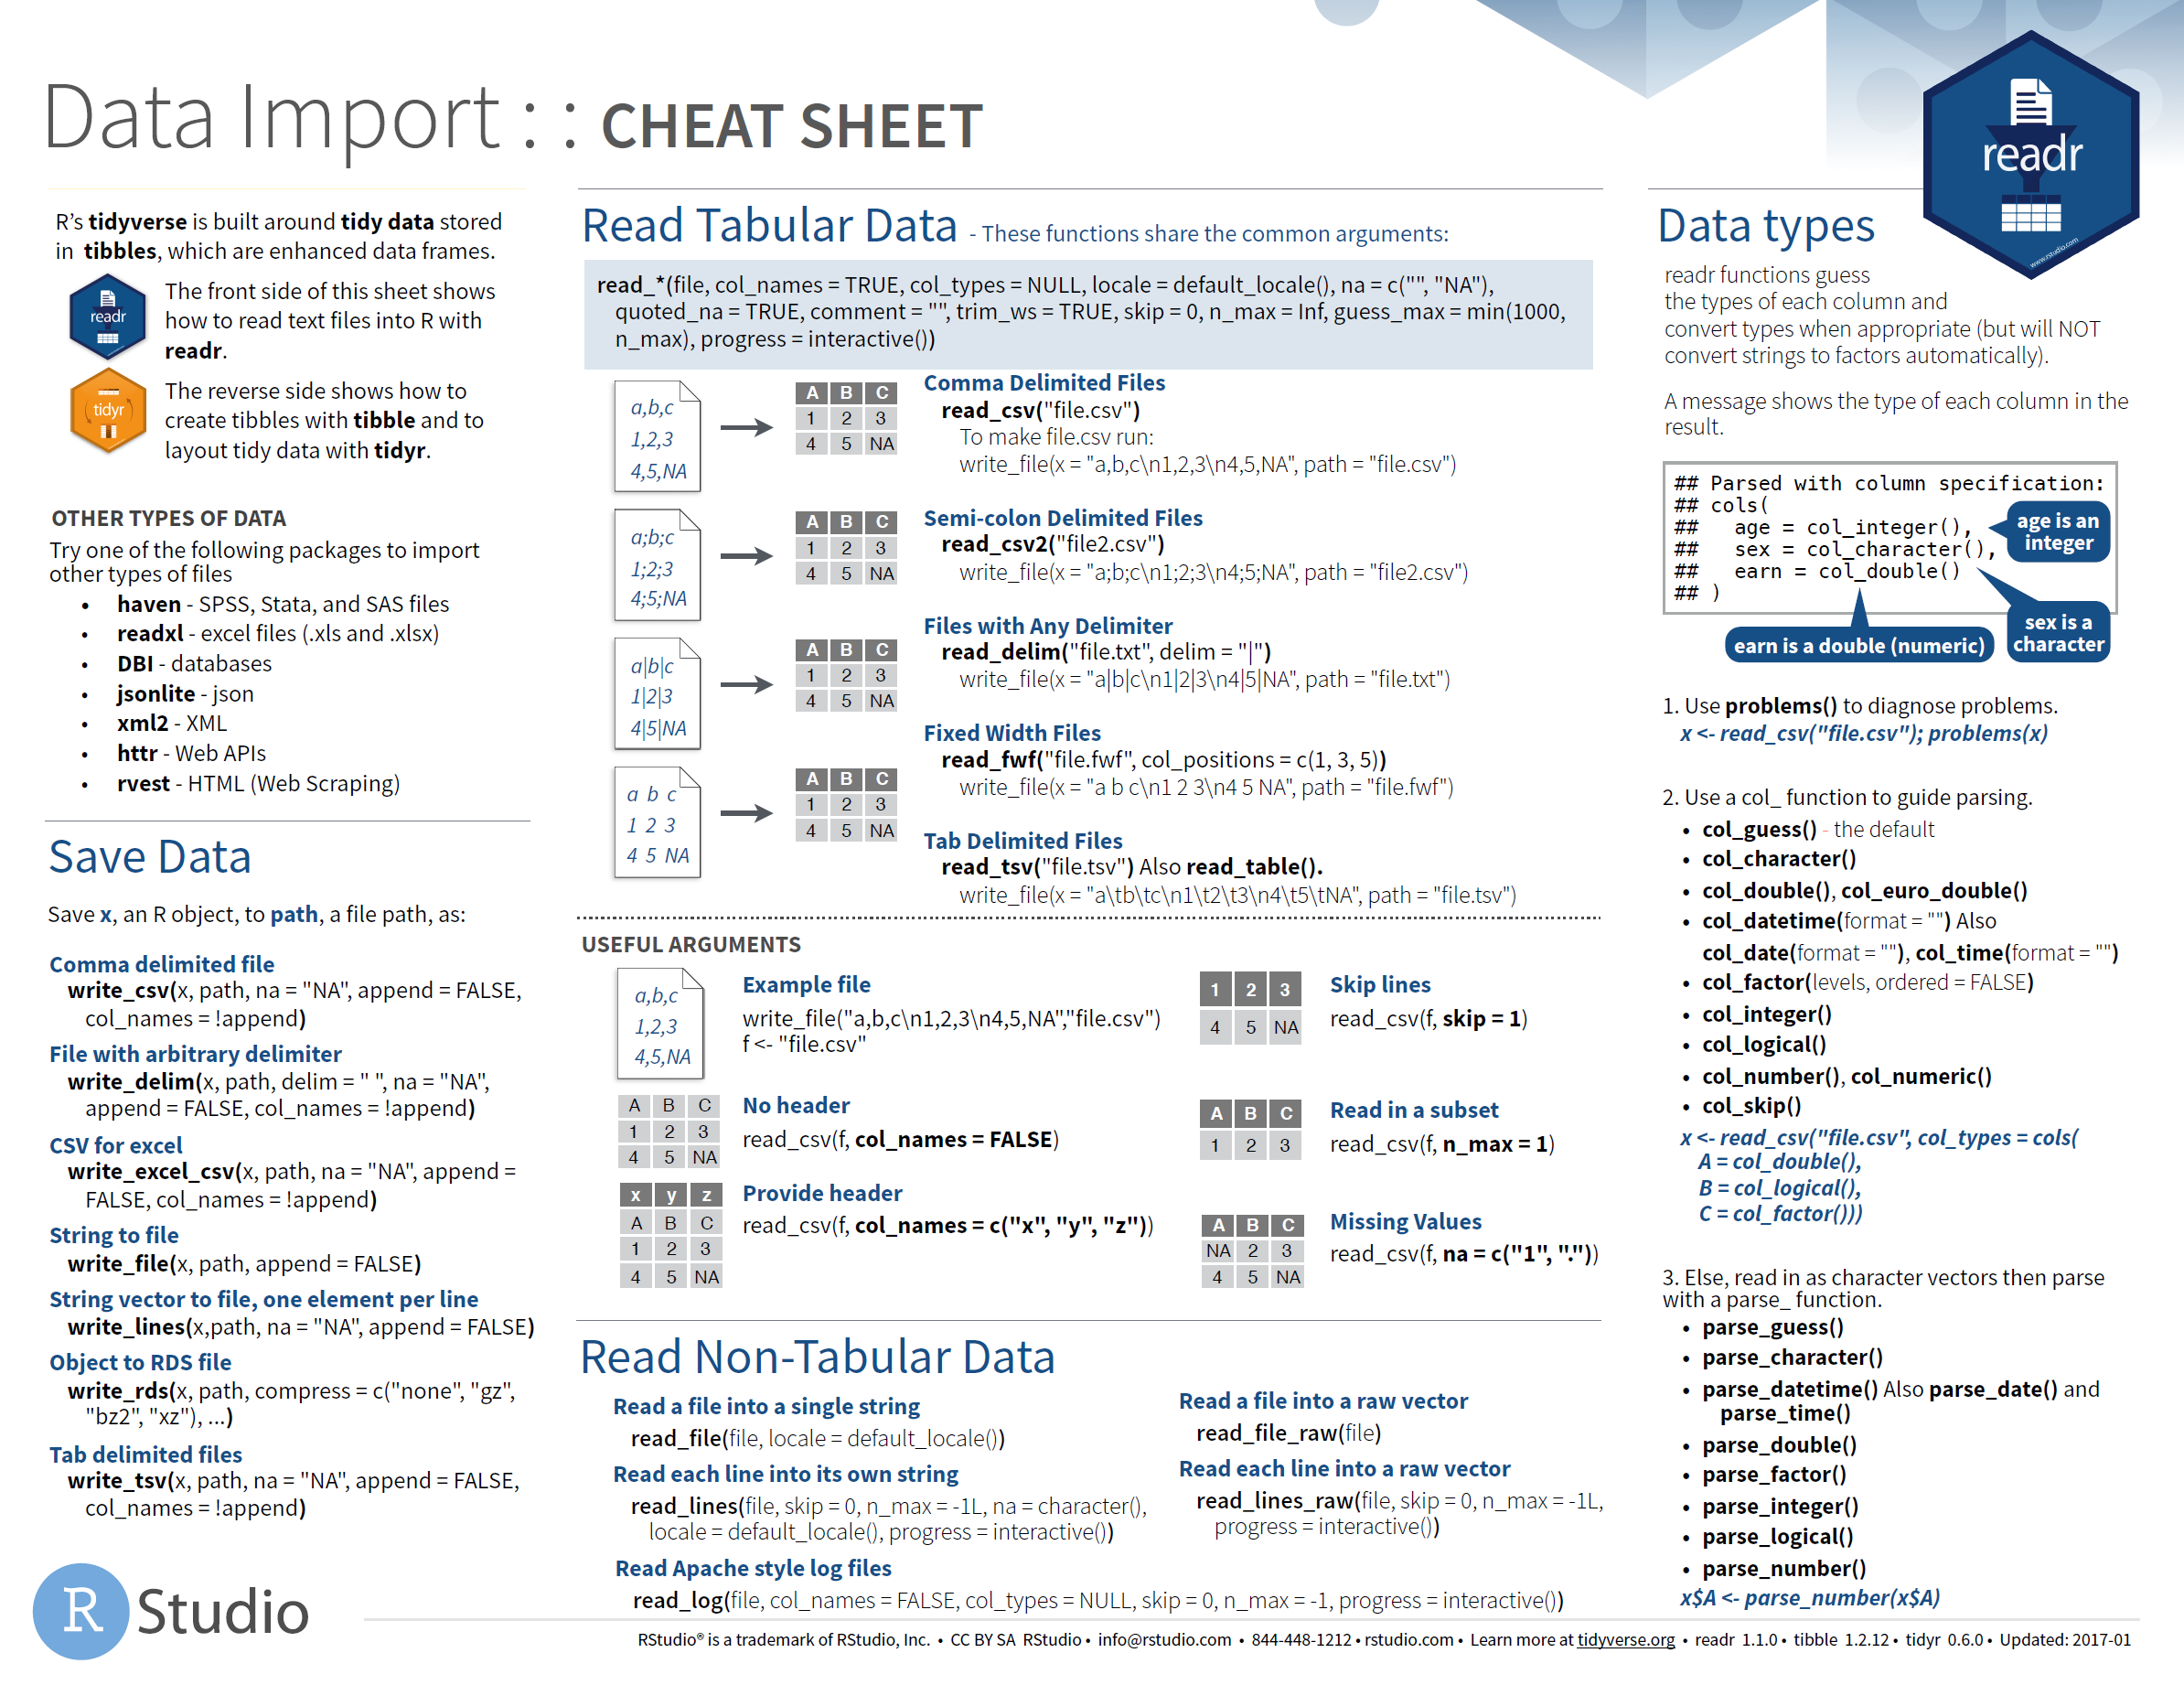
4.1.2.2 Tibbles
When using the Tidyverse packages you may notice they return a tibble rather than a
data.frame They are basically the same thing except construction and subsetting are more
consistent. They also display nicely when printed to the console. The package
tibble has some useful functions for constructing tibbles.
For more detail, read the Tibbles chapter in the R for Data Science book or use the Data Import cheatsheet above for reference.
4.1.2.3 Connecting to Databases
The RStudio Connections Pane makes it possible to easily connect to a variety of data sources, and explore the objects and data inside the connection.
The recommended packages for connecting to databases (also used by RStudio) are:
DBIprovides a standard interface to any databaseodbcfor connecting to databases using ODBCdplyrfor transforming tables in a database
For more detail, read the Databases using R website by RStudio.
4.1.2.4 Web APIs and Pages
Obtaining data from the internet has two main approaches. If the website provides an application programming interface (API) then you can send and receive data through it. The data from web APIs is usually returned in JSON or XML format. Alternatively, you can scrape the website itself, extracting data from the pages. The recommended packages for these approaches are:
4.1.3 Transforming Data
Now you have the data you want, it probably requires some processing in order to get it
into a structure that is useful for analysis. There are two main packages for this
tidyr and dplyr
4.1.3.1 Tidying Data
The focus of tidyr is to get the data into a tidy format.
It provides functions for reshaping the data, as well as dealing with implicit and explicit
missing values.
For more detail, read the Tidy Data chapter in the R for Data Science book or use the Data Import cheatsheet above for reference.
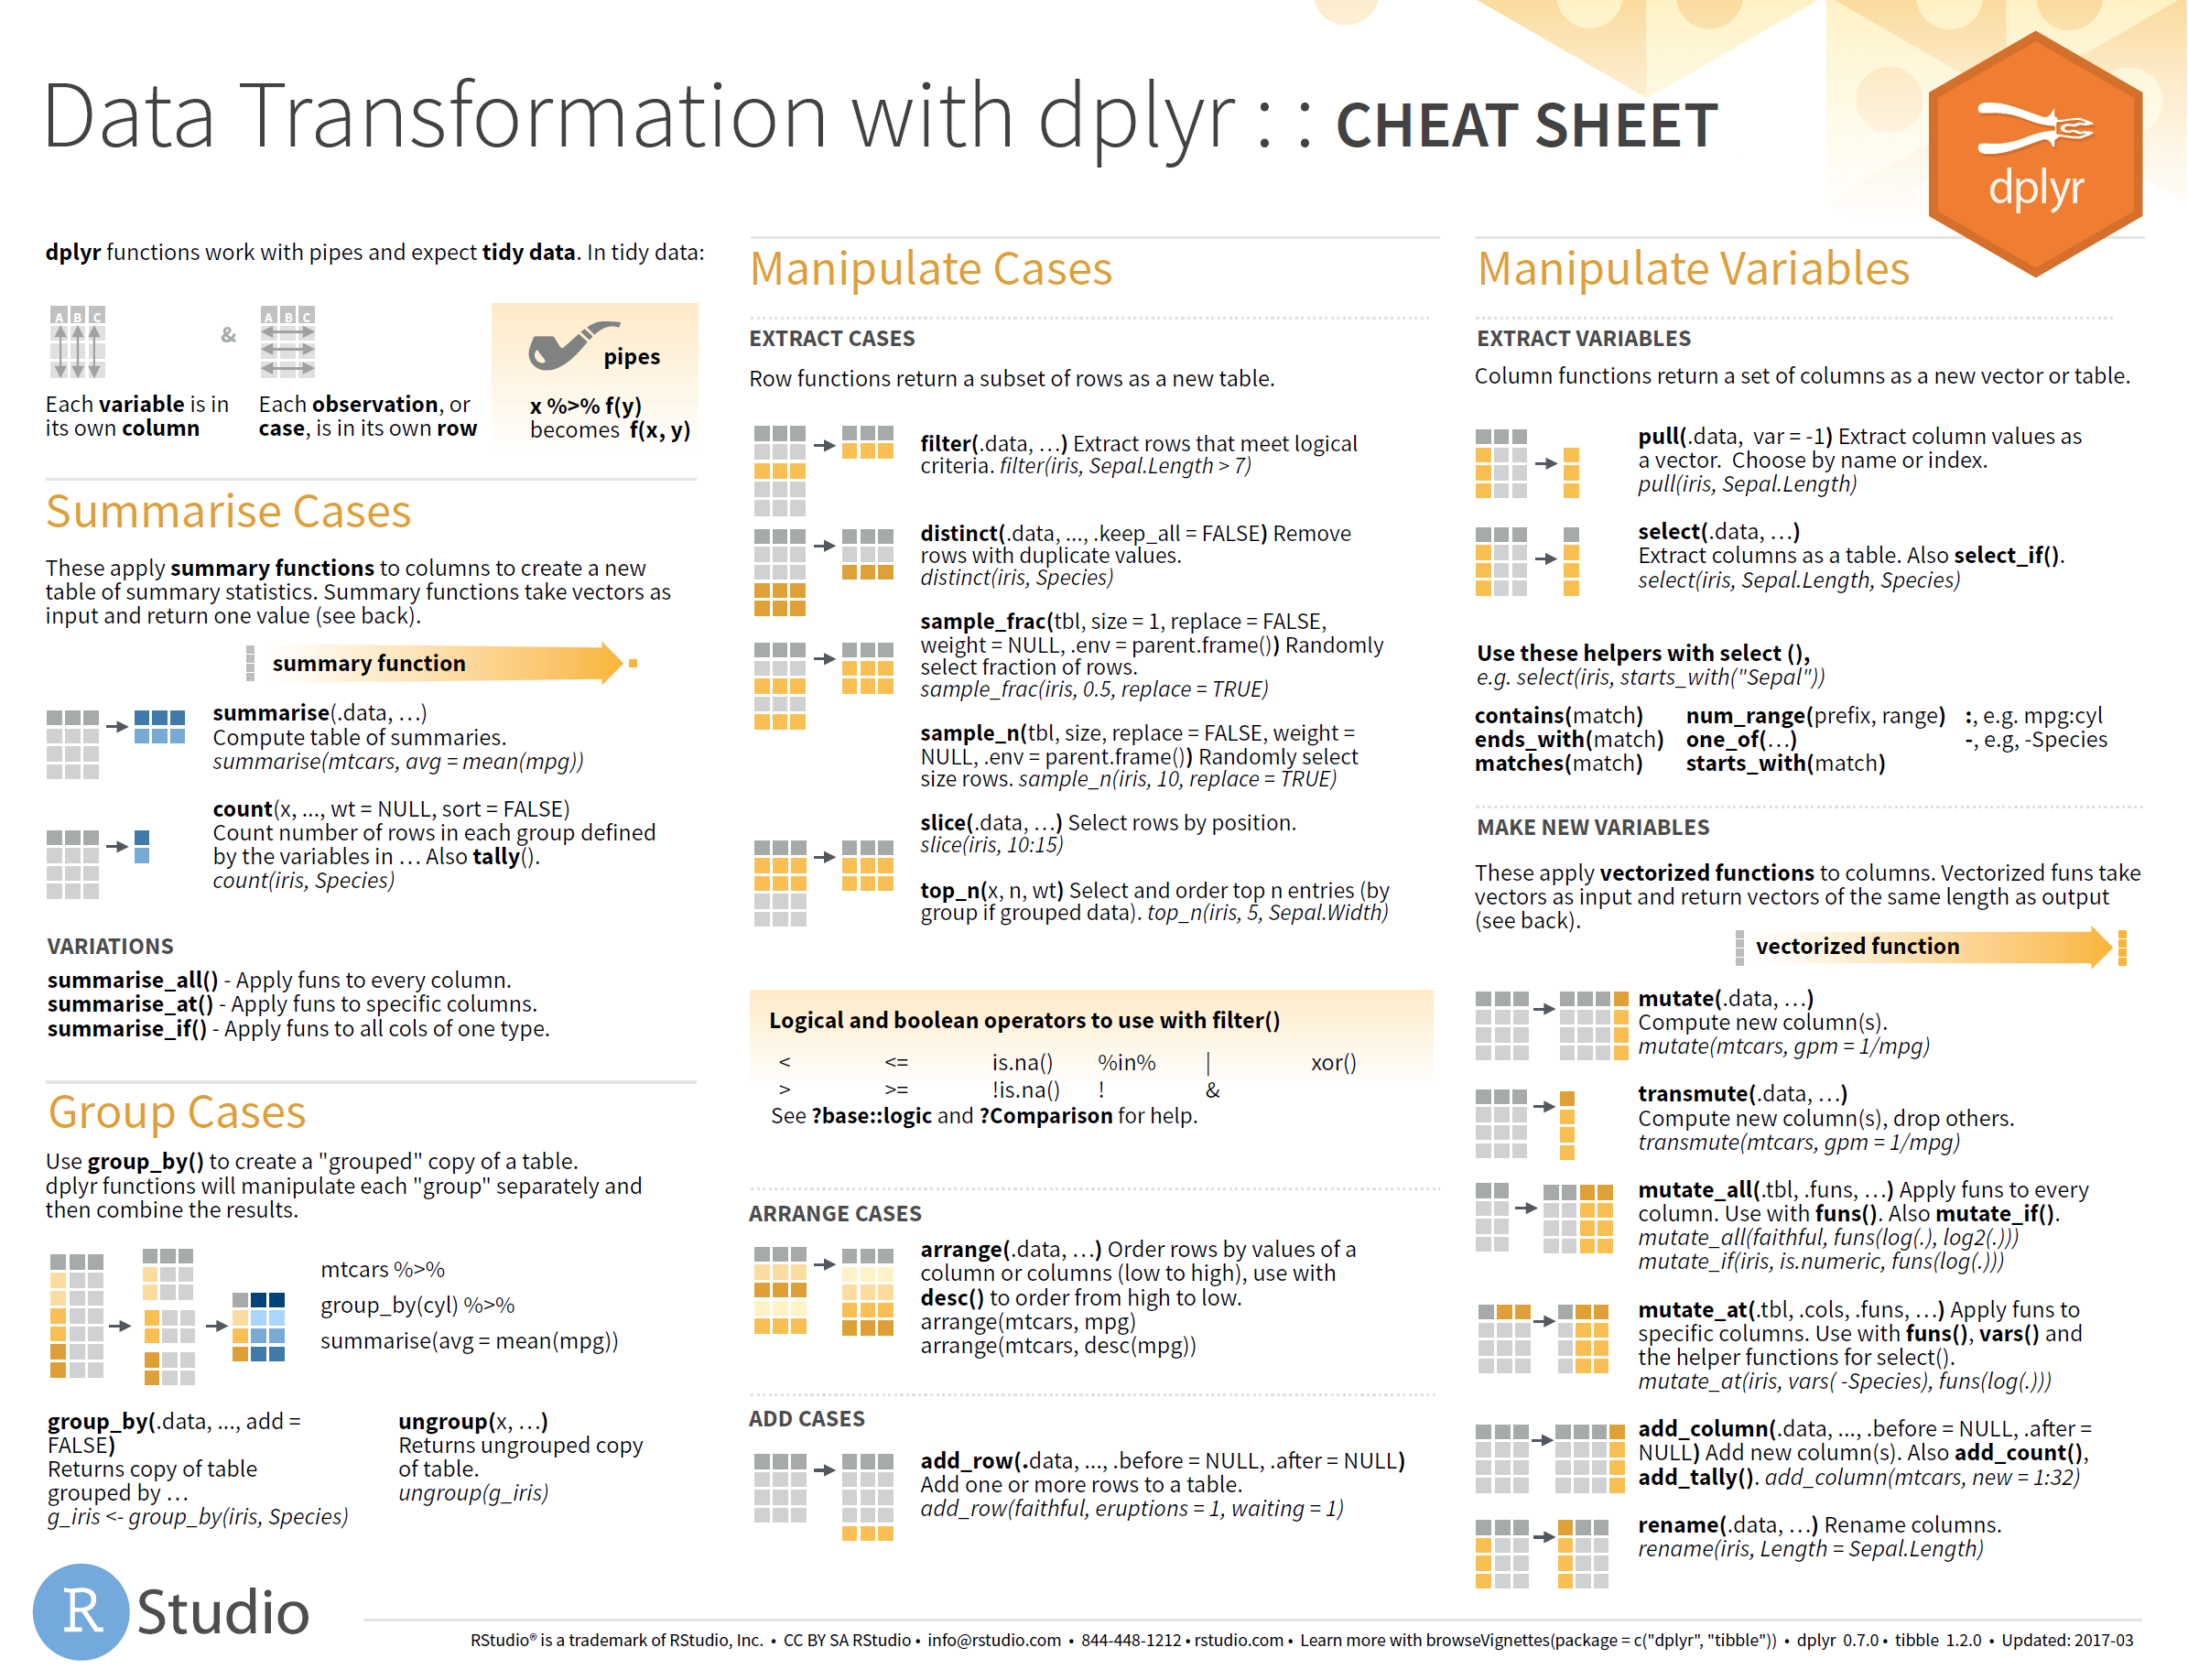
4.1.3.2 Manipulating Data
dplyr is a grammar of data manipulation, providing a
consistent set of verbs that help you solve the most common data manipulation challenges. For
example; Calculating a new variable (or column) based on existing ones, selecting columns,
filtering tables and summarising them by groups. dplyr also
provides a set of functions for combining tables.
For more detail, read the Data Transformation chapter in the R for Data Science book or use the cheatsheet below for reference.
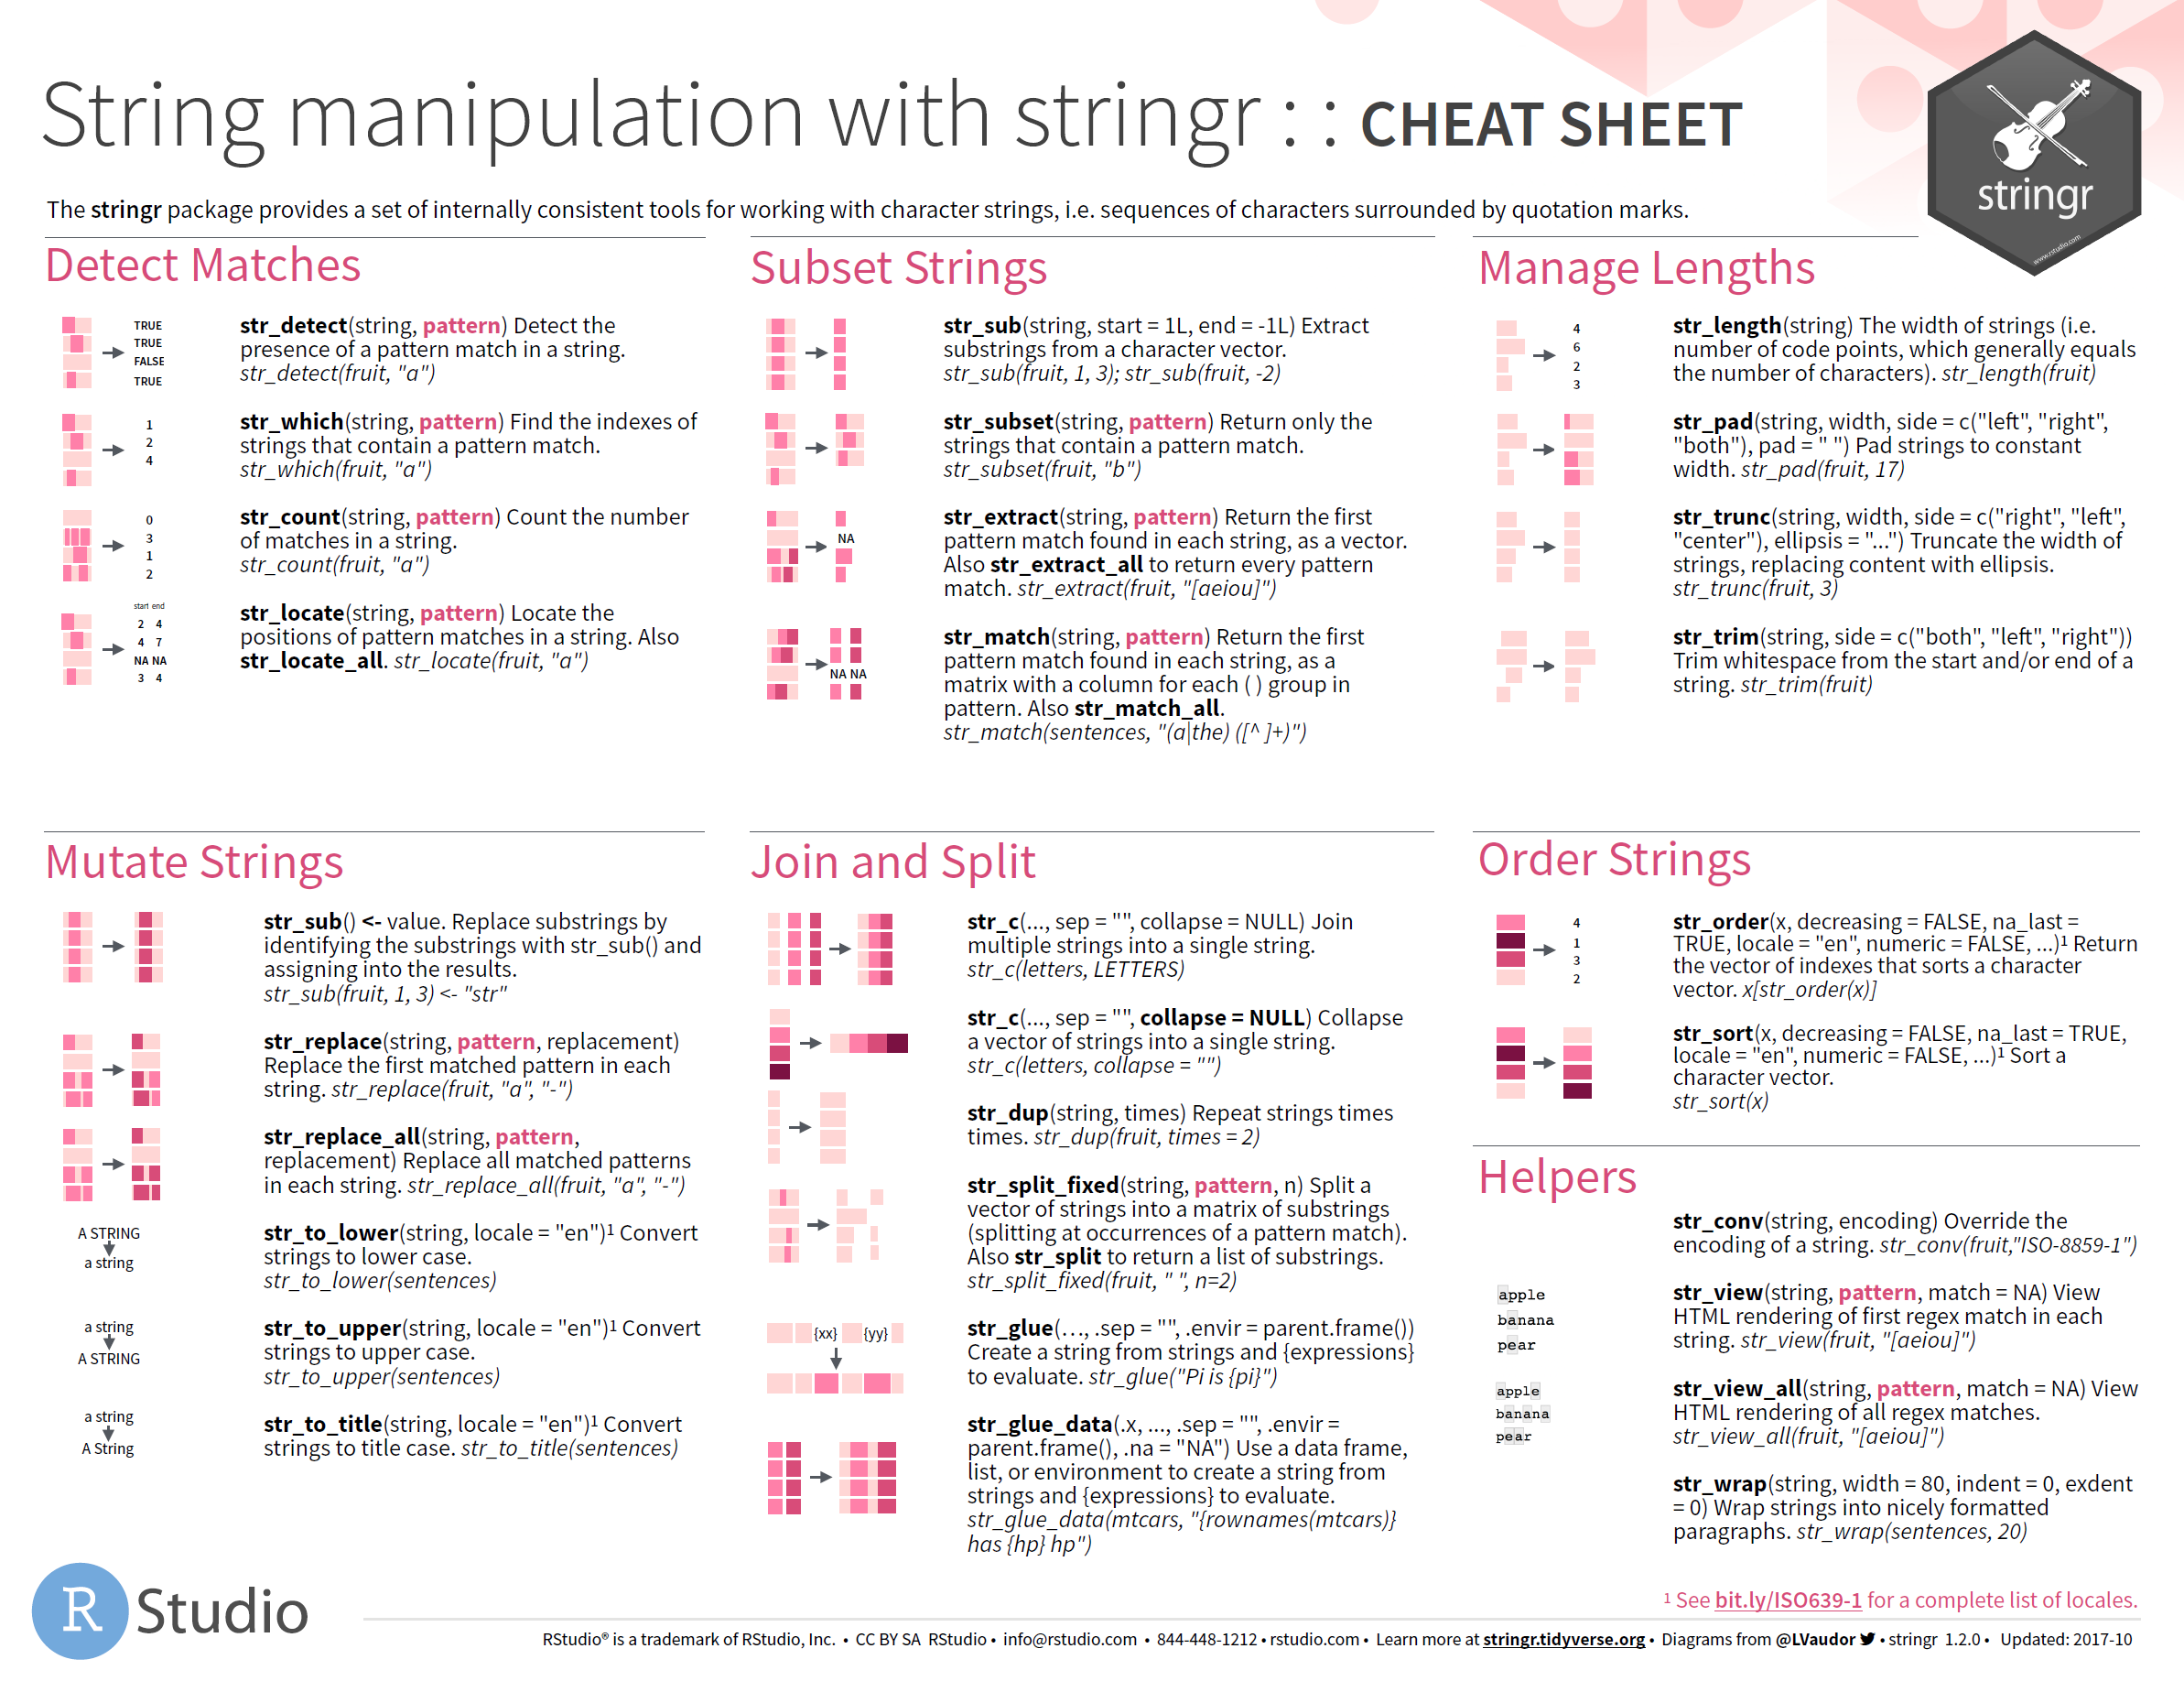
4.1.3.3 Variable Types
There are also packages which simplify working with specific types of data:
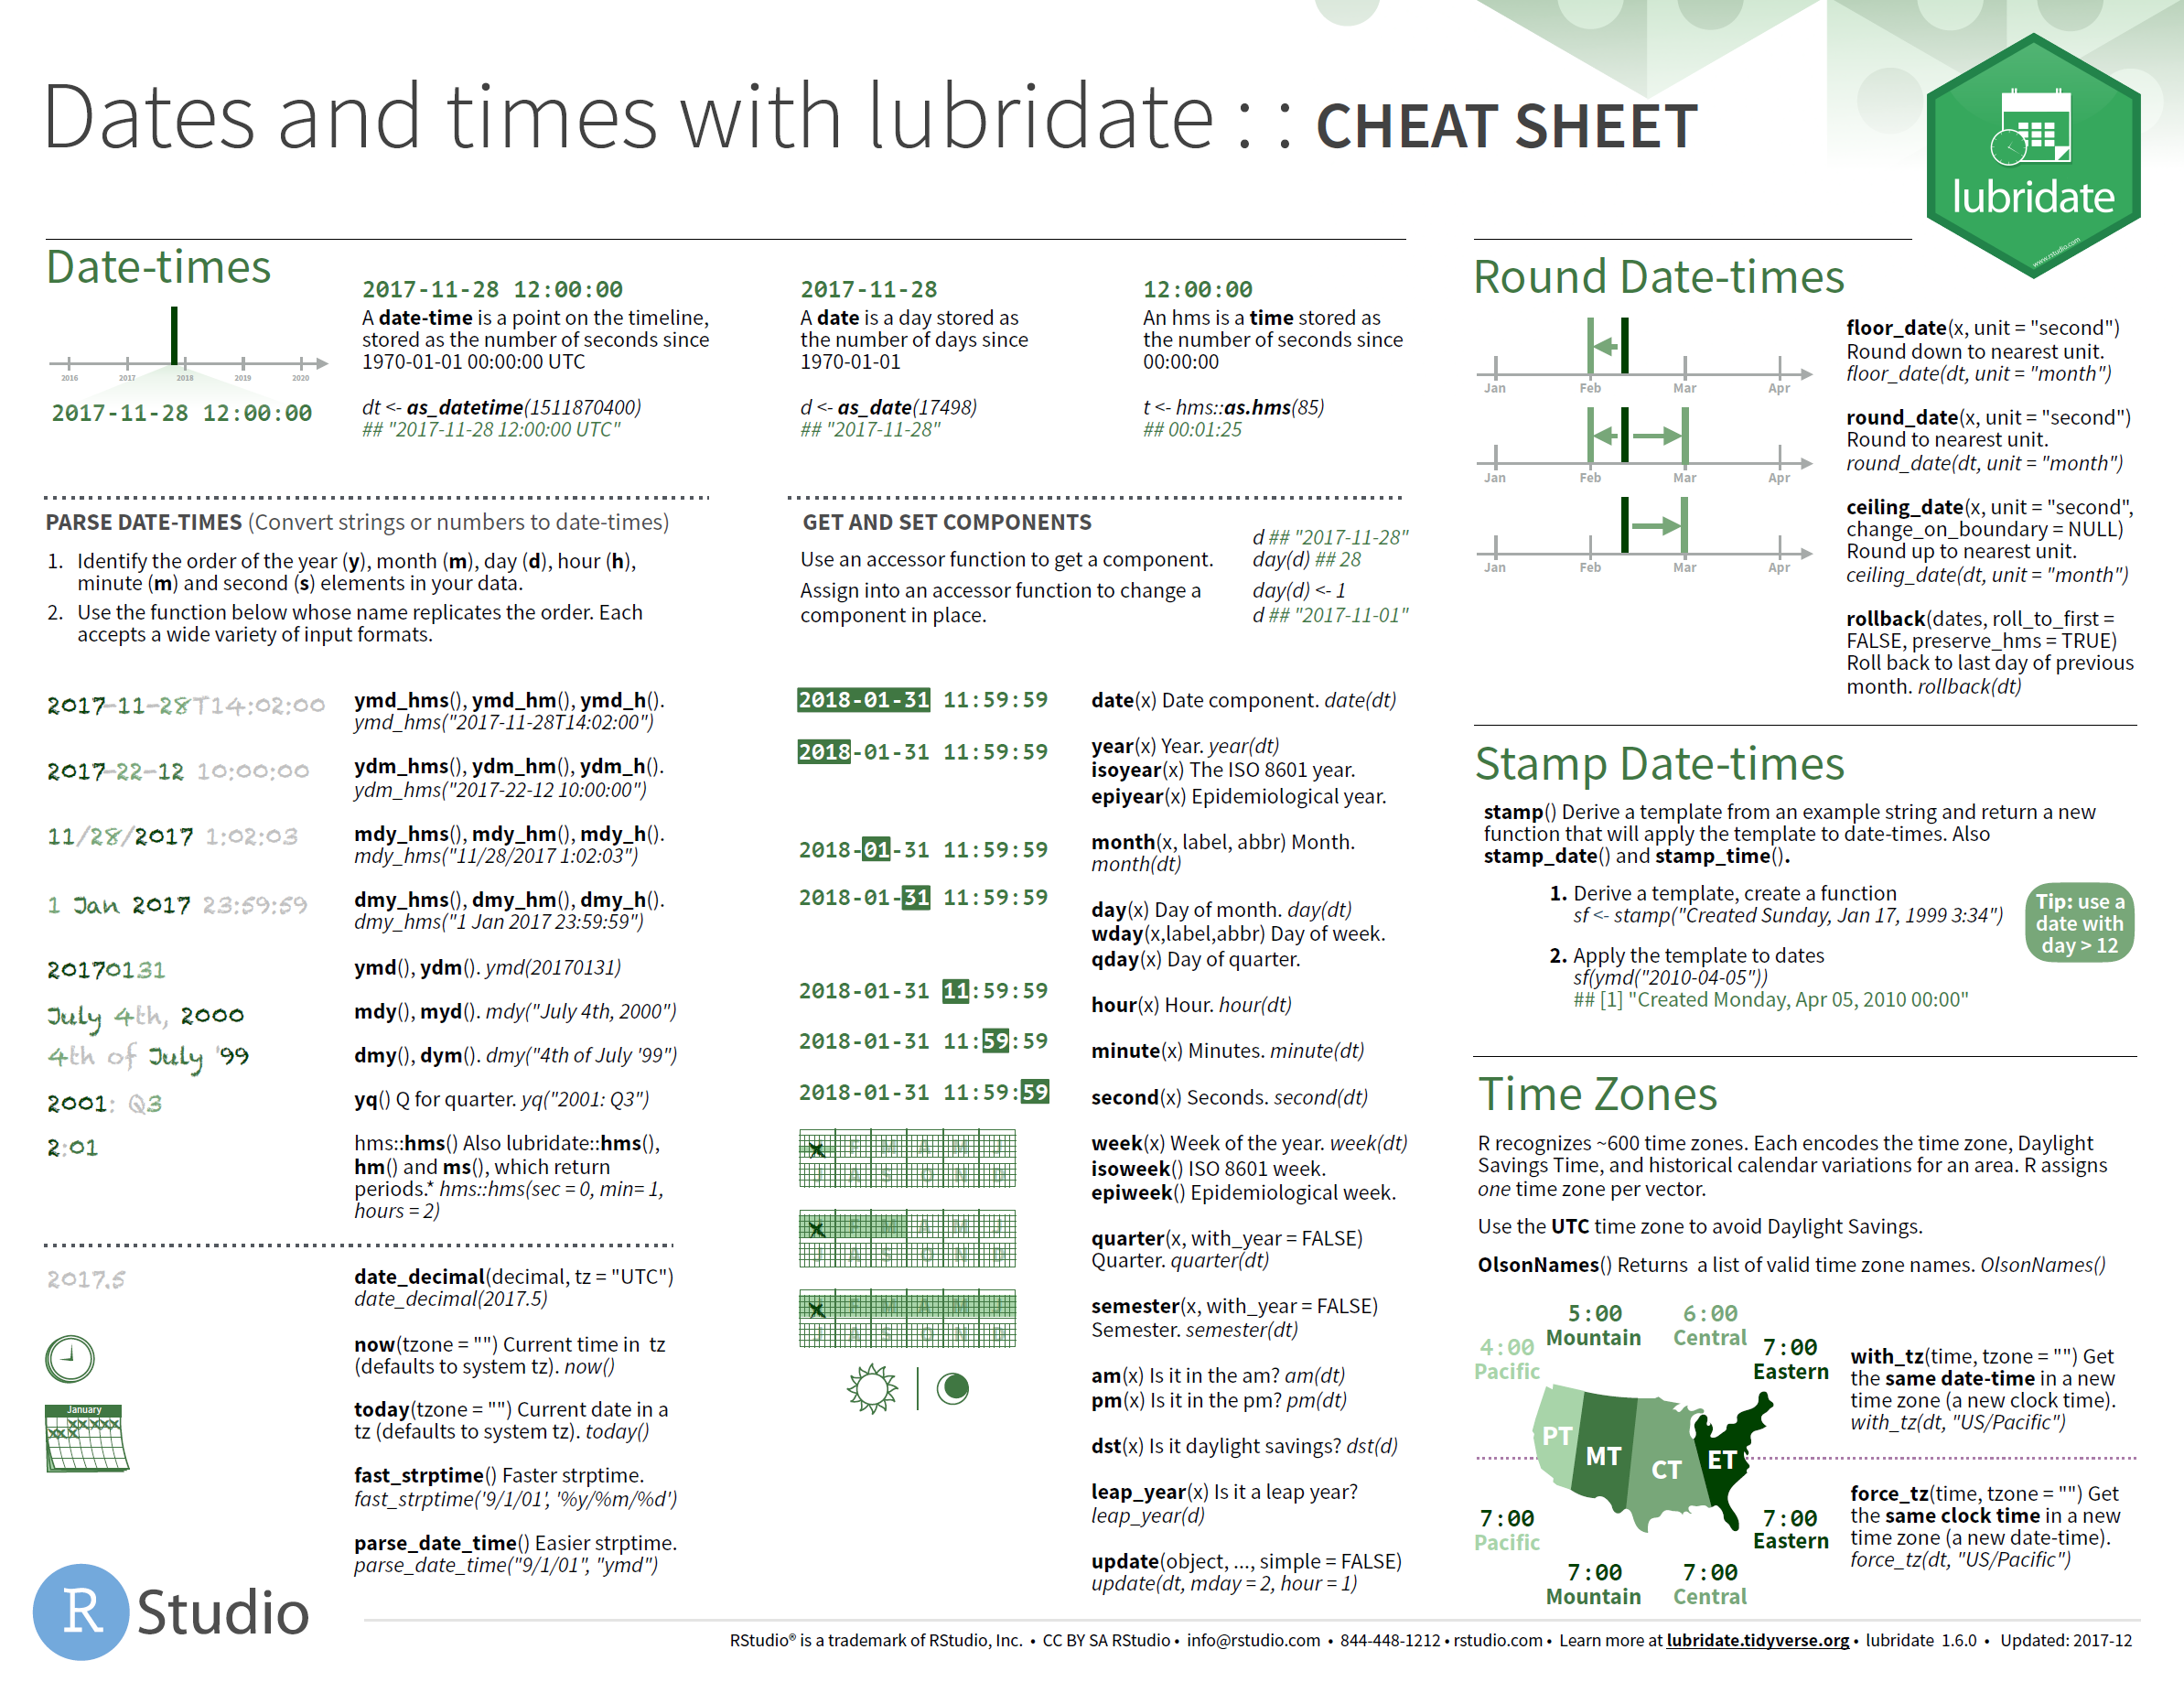
stringrfor strings and regular expressionsforcatsfor factors, used to handle categorical datalubridatefor dates and date-times.hmsfor time-of-day values.
For more detail, read the Strings, Factors, or Dates and Times chapters in the R for Data Science book or use the cheatsheets below for reference.
4.2 Visualising Data
When it comes to visualising data the most commonly used package is
ggplot2. ggplot2
only produces static plots, which is great if you want to insert it into a report, but if you want
to create interactive graphs in a web page use the plotly package.
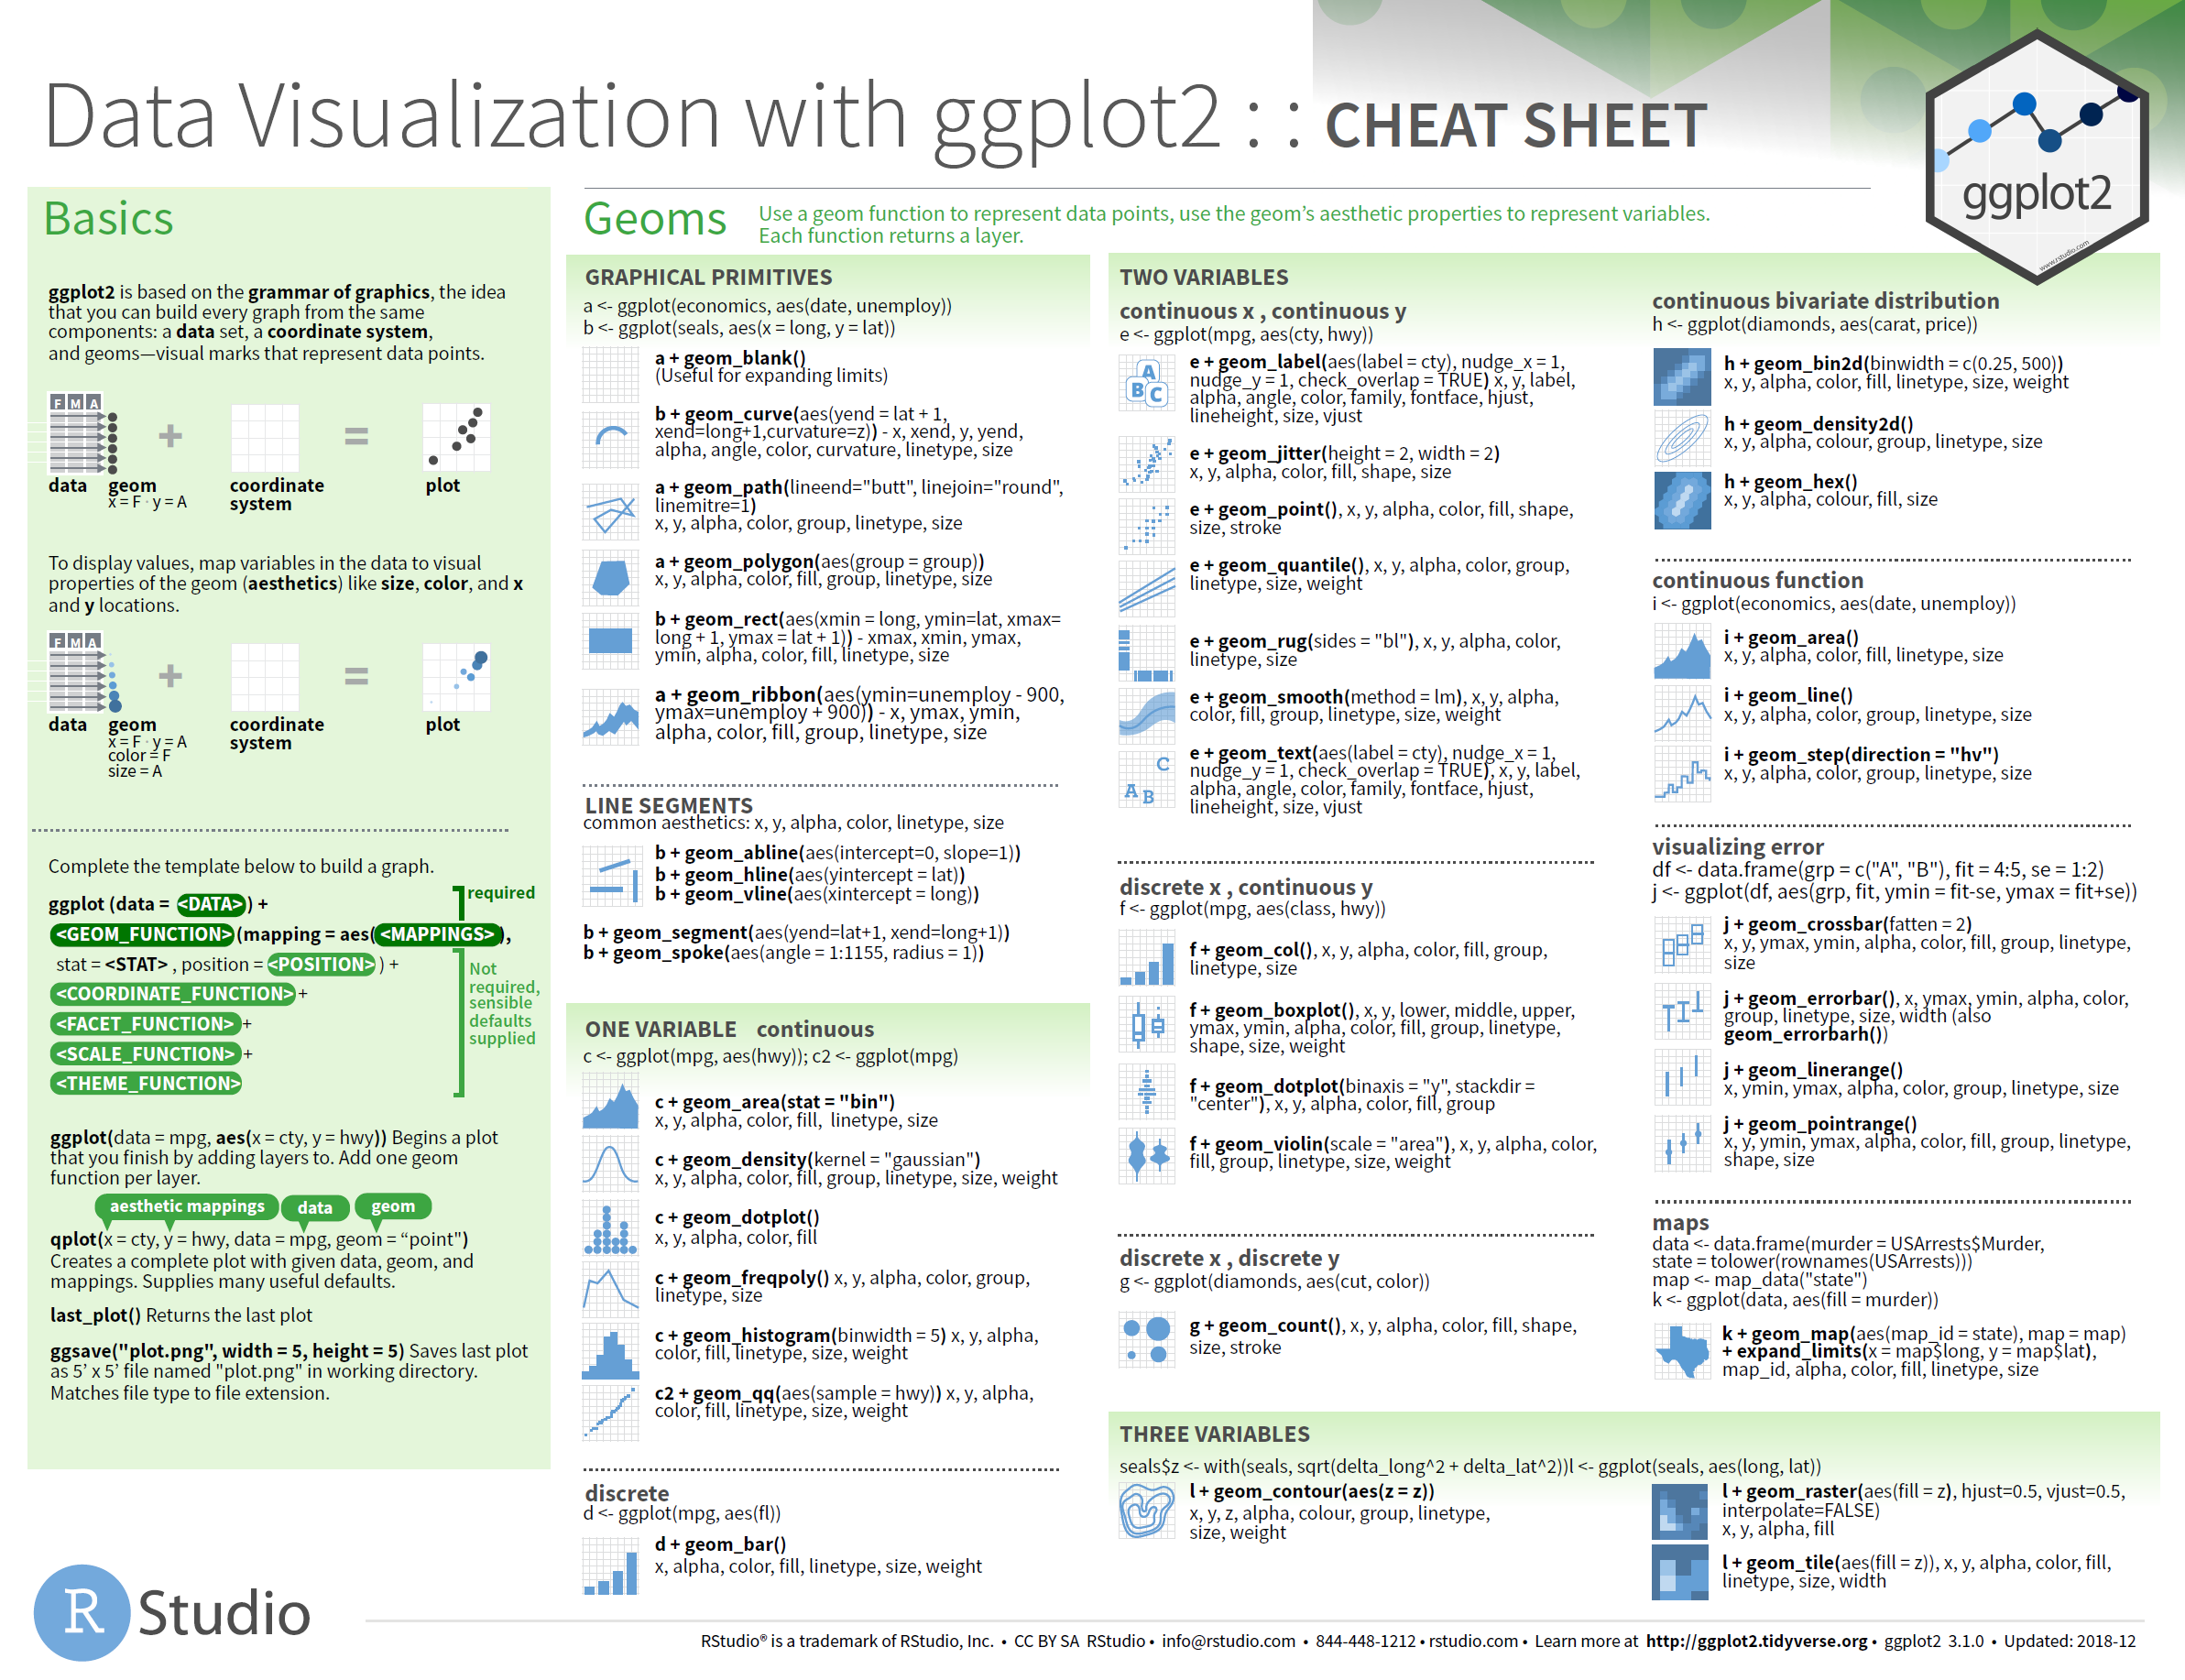
4.2.1 Grammer of Graphics
The ggplot2 package is based on the grammer of graphics which
allows you to create plots by adding layers of geometric objects, e.g. point, lines, etc, with
aesthetics mapped to variables, e.g. coordinates, size, etc. This framework allows for highly
customisable plots.
For more detail, read the Data Visualisation chapter in the R for Data Science book or use the cheatsheet below for reference.
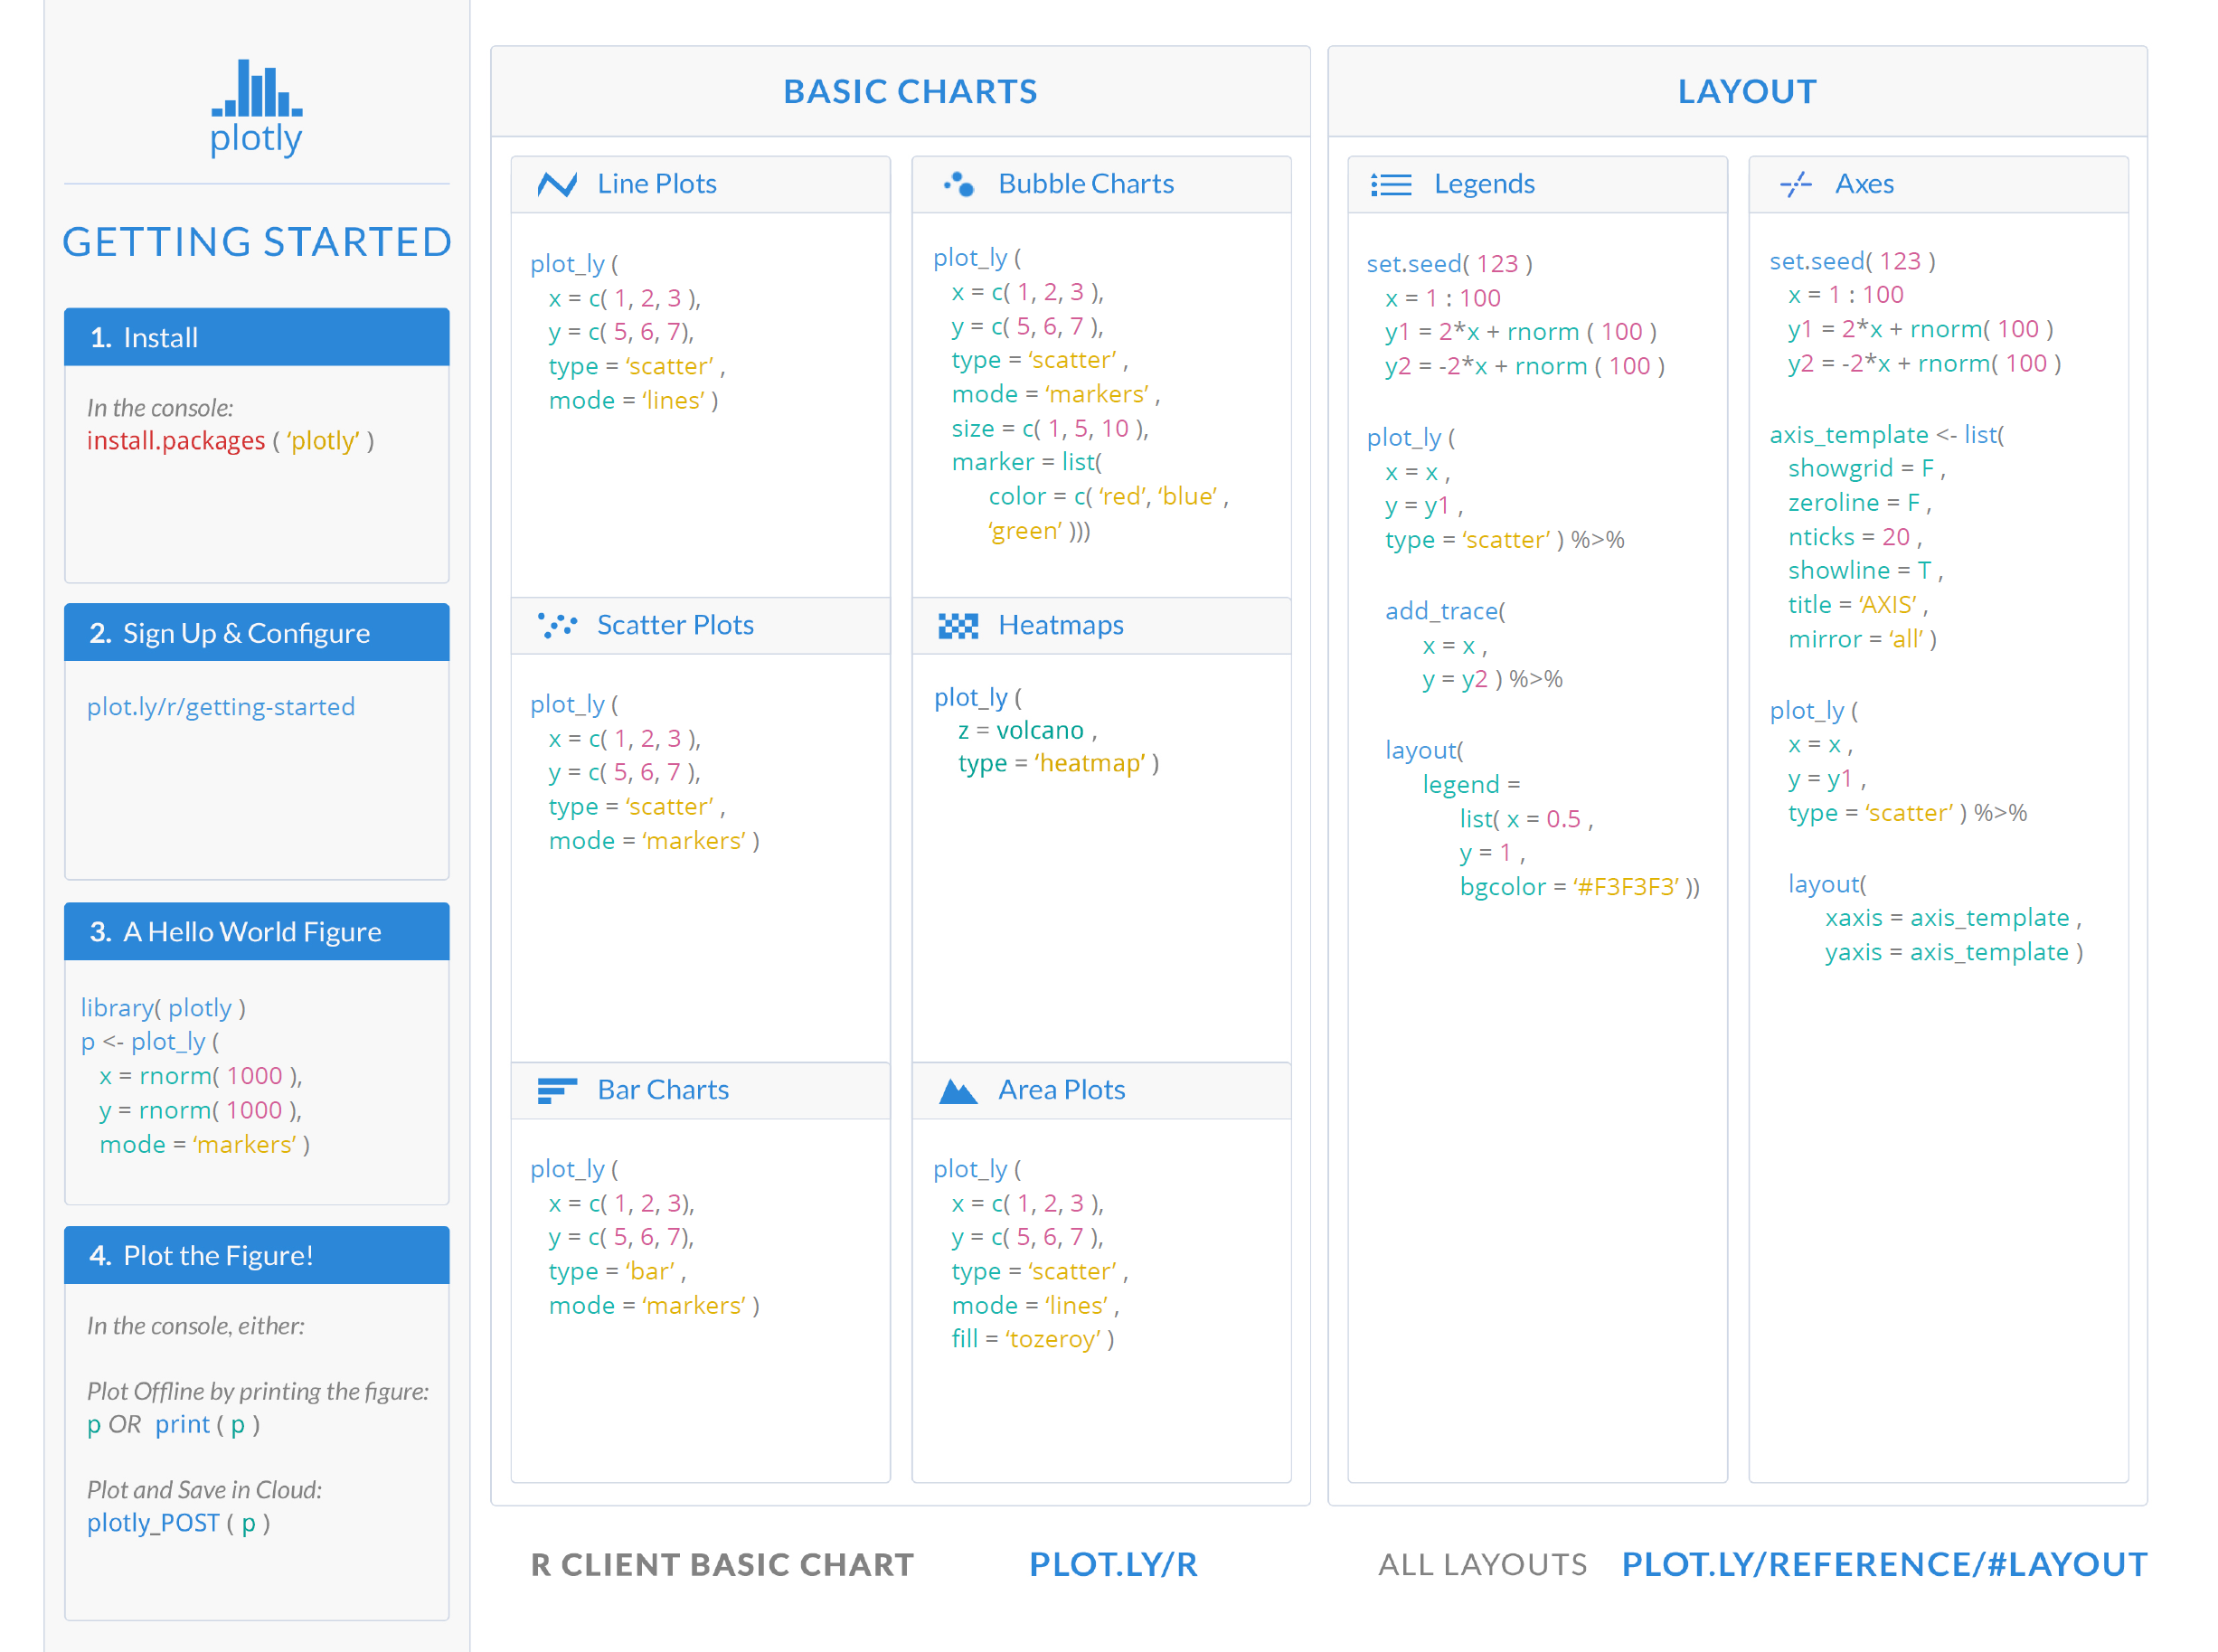
4.2.2 Interactive Graphics
If you want to add a plot to a web page then you’ll probably want something more interactive.
plotly produces high-quality graphics with the ability to zoom, pan and
add tool-tips, etc.
For more detail, read the Plotly for R book or use the cheatsheet below for reference.